The latest readings from the “bubble indicator.”
As you know, I like to convert my intuitive thinking into indicators which I write down as decision rules (principles) that can be back-tested and automated to put together with other principles and bets created the same way to make up a portfolio of alpha bets. I have one of these for bubbles. Having been through many bubbles over my 50+ years of investing, about 10 years ago I described what in my mind makes a bubble and use that to identify them in markets—all markets, not just stocks.
I define a bubble market as one that has a combination of the following in high degrees:
- High prices relative to traditional measures of value (e.g., by taking the present value of their cash flows for the duration of the asset and comparing it with their interest rates).
- Unsustainable conditions (e.g., extrapolating past revenue and earnings growth rates late in the cycle when capacity limits mean that that growth can’t be sustained).
- Many new and naïve buyers who were attracted in because the market has gone up a lot so it’s perceived as a hot market.
- Broad bullish sentiment.
- A high percentage of purchases being financed by debt.
- A lot of forward and speculative purchases made to bet on price gains (e.g., inventories that are more than needed, contracted forward purchases, etc.).
I apply these criteria to all markets to see if they’re in bubbles. I have periodically shown you these for stocks and the stock market.
What Was Shown in January and What Is Shown Now
I will first describe in words and then will show in charts the picture and how it has changed since January, when I last shared an update of the bubble indicator.
In January the bubble indicator showed that a) the US equity market as a whole was at the edge of a bubble but not in an extreme bubble (i.e., 70% of the way toward the highest bubble, which happened in late 1990s and late 1920s) and b) the emerging tech companies (e.g., Tesla and Roku) were clearly in an extreme bubble. I also noted that other bubbly behavior (e.g., SPACs, the IPO boom, the big pickup in options activity) financed by the unprecedented flood of liquidity post-COVID had found its way into the asset markets, making things bubbly. I showed which stocks were in bubbles and created an index of those stocks, which I call “bubble stocks.”
Since then, those bubble stocks popped. They declined by about a third over the last year—while the S&P 500 is about flat. With those and other developments in the market—e.g., meaningful decline in frothy retail activity, meaningful deterioration in sentiment, and more—the emerging tech stocks no longer appear to be in a bubble, but neither do they appear to have substantially swung to the opposite extreme, so it’s not necessarily true that now is a good time to buy them.
Bubbles can take a long time to unwind (two years in the case of the 1929 bubble, one year in the case of the late ’90s tech bubble) and typically go to the opposite extreme, so just because they aren’t at a bubble extreme doesn’t mean they are safe or that it’s a good time to get long. In fact, US stocks in aggregate still look overvalued by our measures. History shows that once the popping begins, bubbles more often overcorrect to the downside versus settling at more “normal” prices.
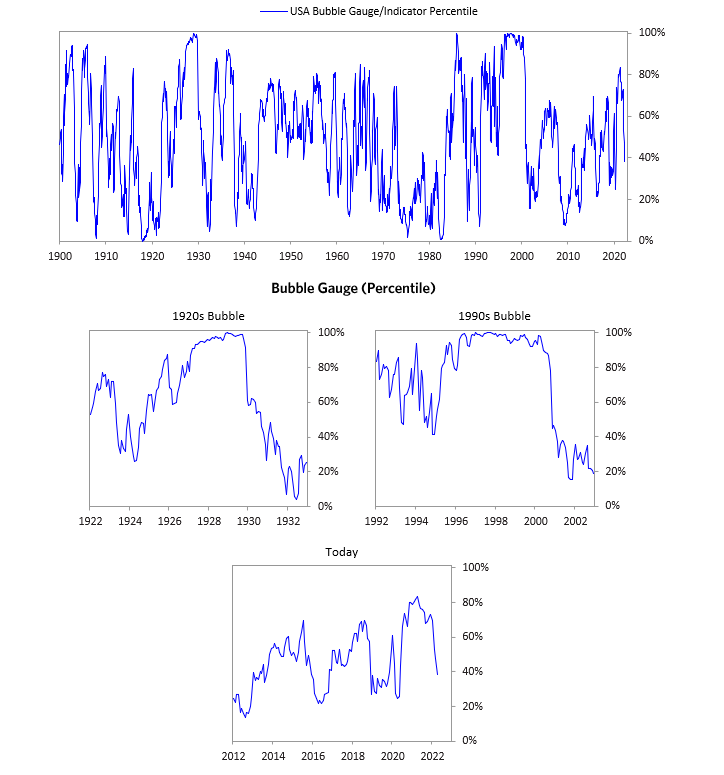
The following charts paint the picture. The first shows the bubble gauge/indicator going back to 1900 for the US equity market as a whole—currently at the 40th percentile. The charts also zoom in on the gauge over the last couple of years, along with the late 1920s bubble and the late 1990s bubble (during both of these cases the gauge reached 100%).
The chart below shows the bubble gauge for the average of the most bubbly companies as defined in 2020. Readings for those companies are meaningfully down.

The charts below show the performance of a basket of emerging tech bubble stocks (what we call the “bubble slice”) versus the S&P 500. Prices have meaningfully declined and have given up most of their post-COVID gains.

The following charts show the price action of the bubble slice today and in the two biggest bubbles—in the 1920s and 1990s. In these charts, you can see the analogous market dynamic, along with two of the key indicators. While these are only two of several indicators, they show how a lot of debt financing stock ownership together with a tightening typically leads to the popping of the bubble.

Everything we’re seeing driving the bubbles in this segment of the market is classic—virtually the same drivers we saw 100 years ago in the 1920s and a little over 20 years ago in the 1990s bubble. For instance, in the last couple months, it was how tightening can act to prick the bubble. To understand these dynamics, you might want to review this case study of the 1920s stock bubble (starting on page 49), from my book Principles for Navigating Big Debt Crises.
The following charts walk through each of the pieces of the bubble gauge for the US stock market as a whole. While I won’t show you exactly how this indicator is constructed because that is proprietary, I will show you some of the sub-aggregate readings and some indicators.
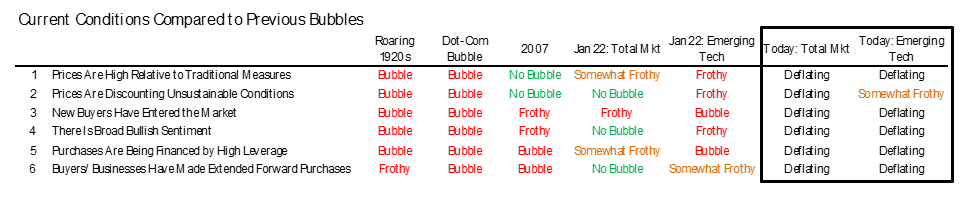
Each of these six influences is measured using a number of stats that are combined into gauges. In the stock market, this approach is applied each stock that I’m looking at. These gauges are combined into aggregate indices by security and then for the market as a whole. The table below shows the current readings of each of these gauges for the US equity market. It shows how the conditions stack up today for US equities in relation to past times. These readings suggest that we’re out of a bubble.
1. How High Are Prices Relative to Traditional Measures?
The current read on this price gauge for US equities is around the 50th percentile.

2. Are Prices Discounting Unsustainable Conditions?
This measure calculates the earnings growth rate that is required to produce equity returns in excess of bond returns. This is derived by looking at individual securities and adding up their readings. Currently, this indicator is just around the 60th percentile for the aggregate market—more elevated than some of our other readings. The earnings growth discounted in stocks is still a bit high.

This is even more noticeable in the US software sector. Analyst earnings growth expectations for this sector have come down, but they are still relatively high compared to history. P/Es have reversed their COVID gains, but remain high compared to history.

3. How Many New Buyers (i.e., Those Who Weren’t Previously in the Market) Have Entered the Market?
A rush of new entrants attracted by rising prices is often indicative of a bubble. This was the case in the 1990s equity bubble and in the 1929 bubble, based on accounts of the time (though, regrettably, our data doesn’t go back that far for this gauge and some of the gauges we’ll show next). This gauge shot above the 90th percentile in 2020 due to the flood of new retail investors into the most popular stocks, which by other measures appeared to be in a bubble. More recently, we have seen meaningful moderation in the pace of retail activity in the markets—it’s now back around pre-COVID averages.

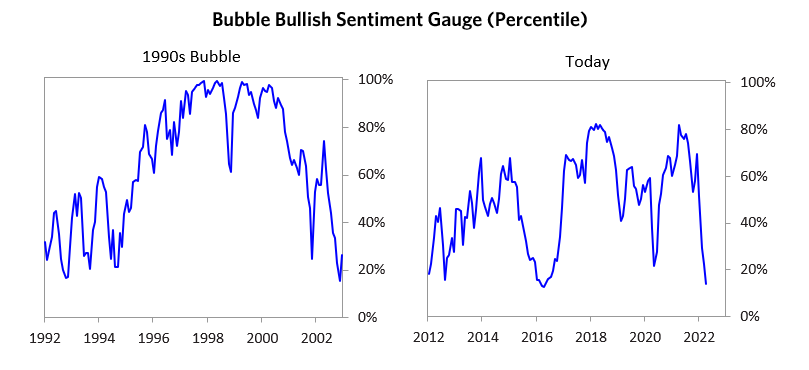
4. How Broadly Bullish Is Sentiment?
The more bullish the sentiment, the more people have already invested, so they are likely to have fewer resources to keep investing and are more likely to sell. Sentiment in the market is now significantly negative.
5. Are Purchases Being Financed by High Leverage?
Leveraged purchases make the underpinnings of the buying weaker and more vulnerable to forced selling in a downturn. The leverage gauge, which looks at the leverage dynamics across all the key players and treats option positions as a form of leverage, is now showing a read around the 50th percentile.

6. To What Extent Have Buyers Made Exceptionally Extended Forward Purchases?
One perspective on whether expectations have become overly optimistic comes from looking at forward purchases. I apply this gauge to all markets and find it particularly helpful in commodity and real estate markets, where forward purchases are most clear. In the equity markets, I look at indicators like capital expenditure—whether businesses (and, to a lesser extent, the government) are investing a lot or a little in infrastructure, factories, etc. It reflects whether businesses are extrapolating current demand into strong demand growth going forward. This gauge is at the 40th percentile, similar to other gauges.

What one chooses to do with this is a tactical decision. While the reversal has been significant, discounting of future earnings remains somewhat high compared to history. And either way, bubbles more often overcorrect (sell off more than the fundamentals would suggest) versus just settling back to normal levels. But I wanted to pass along these updated readings to you in light of what’s now going on in the markets.
Bridgewater Daily Observations is prepared by and is the property of Bridgewater Associates, LP and is circulated for informational and educational purposes only. There is no consideration given to the specific investment needs, objectives or tolerances of any of the recipients. Additionally, Bridgewater's actual investment positions may, and often will, vary from its conclusions discussed herein based on any number of factors, such as client investment restrictions, portfolio rebalancing and transactions costs, among others. Recipients should consult their own advisors, including tax advisors, before making any investment decision. This report is not an offer to sell or the solicitation of an offer to buy the securities or other instruments mentioned.
Bridgewater research utilizes data and information from public, private and internal sources, including data from actual Bridgewater trades. Sources include, the Australian Bureau of Statistics, Bloomberg Finance L.P., Capital Economics, CBRE, Inc., CEIC Data Company Ltd., Clarus Financial Technology, Conference Board of Canada, Consensus Economics Inc., Corelogic, Inc., CoStar Realty Information, Inc., CreditSights, Inc., Credit Market Analysis Ltd., Dealogic LLC, DTCC Data Repository (U.S.), LLC, Ecoanalitica, Energy Aspects, EPFR Global, Eurasia Group Ltd., European Money Markets Institute – EMMI, Evercore, Factset Research Systems, Inc., The Financial Times Limited, GaveKal Research Ltd., Global Financial Data, Inc., Harvard Business Review, Haver Analytics, Inc., The Investment Funds Institute of Canada, ICE Data Derivatives UK Limited, IHS Markit, Impact-Cubed, Institutional Shareholder Services, Informa (EPFR), Investment Company Institute, International Energy Agency (IEA), Investment Management Association, JP Morgan, Lipper Financial, Mergent, Inc., Metals Focus Ltd, Moody’s Analytics, Inc., MSCI, Inc., National Bureau of Economic Research, Organisation for Economic Cooperation and Development (OCED), Pensions & Investments Research Center, Qontigo GmbH, Quandl, Refinitiv RP Data Ltd, Rystad Energy, Inc., S&P Global Market Intelligence Inc., Sentix GmbH, Spears & Associates, Inc., State Street Bank and Trust Company, Sustainalytics, Totem Macro, United Nations, US Department of Commerce, Verisk-Maplecroft, Vigeo-Eiris (V.E), Wind Information(HK) Company, Wood Mackenzie Limited, World Bureau of Metal Statistics, and World Economic Forum. While we consider information from external sources to be reliable, we do not assume responsibility for its accuracy.
The views expressed herein are solely those of Bridgewater as of the date of this report and are subject to change without notice. Bridgewater may have a significant financial interest in one or more of the positions and/or securities or derivatives discussed. Those responsible for preparing this report receive compensation based upon various factors, including, among other things, the quality of their work and firm revenues.
"버블 표시기"의 최신 판독값입니다.
아시다시피, 저는 저의 직관적인 사고를 지표로 바꾸는 것을 좋아합니다. 이것은 다른 원칙과 베팅이 같은 방식으로 만들어지기 위해 백테스트를 하고 자동화할 수 있는 결정 규칙(원칙)으로 적을 수 있습니다. 이거 하나 있어요. 거품용. 50년 이상의 투자 기간 동안 많은 거품을 겪어온 저는 약 10년 전에 제 마음속에서 거품을 만들고 그것을 주식뿐만 아니라 모든 시장에서 그것들을 식별하는 데 사용하는 것에 대해 설명했습니다.
나는 버블 시장을 다음과 같은 높은 수준의 조합으로 정의한다.
전통적인 가치 척도와 관련된 높은 가격(예: 자산 기간 동안 현금흐름의 현재가치를 가져와서 이자율과 비교함)
지속 가능하지 않은 조건(예: 용량 제한이 성장을 지속할 수 없다는 것을 의미하는 주기의 후반부에 과거의 수익 및 수익 증가율을 추정하는 것)
시장이 많이 올라서 핫마켓으로 인식되기 때문에 많은 신규, 순진한 바이어들이 몰렸다.
광범위한 강세 감정.
구매의 높은 퍼센트는 부채로 자금을 조달한다.
많은 선물 및 투기적 구매는 가격 상승에 베팅하기 위해 이루어졌다(예: 필요 이상의 재고, 계약 선물 구매 등).
저는 이 기준을 모든 시장에 적용하여 거품이 있는지 확인합니다. 저는 주식과 주식시장에 대해 주기적으로 보여드렸습니다.
1월에 상영된 내용과 현재 상영된 내용
저는 먼저 말로 설명하고 그 다음에 그림 그리고 제가 마지막으로 버블 인디케이터의 업데이트를 공유했던 1월 이후 어떻게 바뀌었는지 차트에 보여줄 것입니다.
1월에 버블 지표는 a) 미국 주식 시장이 전반적으로 버블의 가장자리에 있었지만 극단적인 버블(즉, 1990년대 후반과 1920년대 후반에 발생한 가장 높은 버블(거품)로 향하는 길의 70%)에 따르면, b) 신흥 기술 회사들(예: 테슬라 및 로쿠)은 분명히 버블에 있었다. 나는 또한 전례 없는 코로나 이후 유동성 범람에 의해 자금 조달된 다른 거품 행태(예: SPAC, IPO 붐, 옵션 활동의 큰 상승)가 자산 시장에 진출하여 상황을 거품처럼 만들었다고 언급했다. 저는 어떤 주식이 거품 속에 있는지를 보여주고 그 주식의 지수를 만들었습니다. 저는 이것을 "거품주"라고 부릅니다.
그 이후로, 그 거품 주식들은 터졌다. S&P 500 지수는 거의 제자리걸음을 하는 반면, 작년에 비해 약 3분의 1 정도 하락했습니다. 이러한 현상 및 기타 시장 동향(예: 거품이 이는 소매 활동의 의미 있는 감소, 심리의 의미 있는 악화 등)으로 인해 신흥 기술주들은 더 이상 거품이 꺼지는 것처럼 보이지 않지만, 둘 다 실질적으로 반대 극단으로 돌아선 것처럼 보이지 않으므로 지금이 매수하기에 좋은 시기라고는 할 수 없습니다. 그들.
버블이 풀리는 데 오랜 시간이 걸릴 수 있고(버블 1929년 버블의 경우 2년, 90년대 말 기술 버블의 경우 1년), 전형적으로 정반대의 극단으로 갈 수 있기 때문에 버블 극단에 있지 않다고 해서 그들이 안전하거나 오래 살 수 있는 좋은 시기라는 것을 의미하지는 않는다. 사실, 미국 주식은 여전히 우리의 조치에 의해 과대평가된 것처럼 보인다. 역사는 일단 팝업이 시작되면, 거품이 더 "정상적인" 가격으로 정착하는 것에 비해 부정적인 방향으로 더 많이 수정된다는 것을 보여준다.
다음 차트는 그림을 그립니다. 첫 번째는 미국 주식 시장 전체의 버블 게이지/지표가 1900년으로 거슬러 올라가는 것을 보여준다. 현재 40번째 백분위수이다. 차트는 또한 1920년대 후반의 버블과 1990년대 후반의 버블과 함께 지난 몇 년 동안 게이지를 확대한다(두 경우 모두 게이지는 100%에 달했다).
이 이미지에 대해 제공된 alt 텍스트가 없습니다.
아래 차트는 2020년에 정의된 가장 거품이 많은 기업의 평균에 대한 버블 게이지를 보여줍니다. 그 회사들의 수치는 유의미하게 하락하고 있다.
이 이미지에 대해 제공된 alt 텍스트가 없습니다.
아래 차트는 S&P 500 대비 신흥 기술 버블 주식 바스켓("버블 슬라이스")의 성능을 보여줍니다. 가격은 의미 있게 하락했고 코로나 이후 상승분의 대부분을 포기했다.
이 이미지에 대해 제공된 alt 텍스트가 없습니다.
다음 차트는 현재 버블 슬라이스와 1920년대와 1990년대 두 개의 가장 큰 버블에서 가격 작용을 보여준다. 이러한 차트에서는 두 가지 주요 지표와 함께 유사한 시장 동태를 확인할 수 있습니다. 이것들은 단지 몇 가지 지표들 중 두 가지이지만, 그것들은 긴축과 함께 많은 부채 자금 조달 주식 소유가 어떻게 전형적으로 버블의 폭발을 초래하는지 보여준다.
이 이미지에 대해 제공된 alt 텍스트가 없습니다.
이 시장의 버블을 주도하는 모든 것은 고전적입니다. 사실상 100년 전인 1920년대와 20년 전 1990년대 버블에서 보았던 것과 같습니다. 예를 들어, 지난 몇 달 동안, 그것은 어떻게 긴축이 거품을 찌르는 역할을 할 수 있는지였다
이러한 역학을 이해하기 위해, 여러분은 제 책 "대채무 위기 탐색의 원칙"에서 나온 1920년대 주식 거품 사례 연구(49페이지부터)를 검토하는 것이 좋을지도 모릅니다.
다음 차트는 미국 주식 시장 전반에 대한 버블 게이지의 각 부분을 살펴본다. 이 표시기가 어떻게 구성되는지 정확하게 보여드리지 않겠습니다. 왜냐하면 그것은 독점적인 것이기 때문입니다. 제가 여러분께 서브집약적 판독치와 몇 가지 지표를 보여드리겠습니다.
이 여섯 가지 영향 각각은 게이지로 결합된 여러 통계를 사용하여 측정됩니다. 주식시장에서는 내가 보고 있는 종목마다 이 접근법이 적용된다. 이러한 게이지는 보안에 의해 집계 지수로 결합된 후 시장 전체에 대해 결합됩니다. 아래 표는 미국 주식 시장에 대한 각 게이지의 현재 판독치를 보여줍니다. 그것은 과거에 비해 오늘날 미국 주식에 대한 조건이 어떻게 쌓이는지를 보여준다. 이 수치들은 우리가 거품이 빠졌다는 것을 암시한다.
이 이미지에 대해 제공된 alt 텍스트가 없습니다.
1. 전통적인 조치와 비교하여 가격이 얼마나 높은가?
미국 주식에 대한 이 가격 측정기의 현재 수치는 약 50퍼센트이다.
이 이미지에 대해 제공된 alt 텍스트가 없습니다.
2. 가격이 지속 가능하지 않은 조건을 할인하고 있는가?
이 척도는 채권 수익률을 초과하는 자기자본 수익률을 내기 위해 필요한 수익 증가율을 산출한다. 이것은 개별 유가증권을 보고 그 수치를 합산함으로써 도출된다. 현재 이 지표는 집계 시장의 약 60번째 백분위수로, 다른 수치보다 더 높습니다. 주식에서 할인된 수익 증가율은 여전히 약간 높다.
이 이미지에 대해 제공된 alt 텍스트가 없습니다.
이는 미국 소프트웨어 분야에서 더욱 두드러진다. 이 부문의 애널리스트 실적 성장 기대치는 낮아졌지만, 여전히 역사에 비해 상대적으로 높은 수준이다. P/E는 코로나 상승폭을 역전시켰지만, 역사에 비해 높은 수준을 유지하고 있다.
이 이미지에 대해 제공된 alt 텍스트가 없습니다.
3. 시장에 진입하지 않은 신규 구매자(예: 이전에 시장에 진출하지 않은 고객)는 얼마나 됩니까?
가격 상승에 이끌린 신규 진입자들의 쇄도는 종종 거품을 나타낸다. 이것은 1990년대 주식 거품과 1929년 거품에서 그 시대의 설명에 근거한 경우였다. (그러나 유감스럽게도, 우리의 데이터는 이 측정 기준과 다음에 우리가 보여줄 일부 측정 기준들에 대해 그렇게 멀리 거슬러 올라가지 않는다.) 이 지표는 가장 인기 있는 종목에 신규 개인투자자가 몰리면서 2020년 90분위기를 넘어섰고, 다른 조치로는 거품이 낀 것으로 보였다. 보다 최근에는 시장에서의 소매 활동 속도가 유의미하게 완화되고 있습니다. 이는 이제 코로나 이전 평균 수준으로 회복되었습니다.
이 이미지에 대해 제공된 alt 텍스트가 없습니다.
4. 감정은 얼마나 광범위하게 강세인가?
심리가 강세일수록 이미 투자한 사람이 많아져 계속 투자할 재원이 적어지고 매도 가능성도 높아진다. 시장의 정서는 현재 상당히 부정적이다.
이 이미지에 대해 제공된 alt 텍스트가 없습니다.
5. 높은 레버리지로 구매 자금을 조달하고 있습니까?
레버리지 구매는 구매의 기초를 약화시키고 침체기에 강제 매도에 더 취약하게 만든다. 모든 주요 주체의 레버리지 역학을 살펴보고 옵션 포지션을 레버리지의 형태로 취급하는 레버리지 게이지는 현재 50번째 백분위수에 대한 판독치를 보여주고 있습니다.
이 이미지에 대해 제공된 alt 텍스트가 없습니다.
6. 구매자는 어느 정도까지 예외적으로 선물 구매를 연장했습니까?
기대가 지나치게 낙관적이 되었는지에 대한 한 가지 관점은 선물 구매를 보는 데서 나온다. 나는 이 게이지를 모든 시장에 적용하고 선물 구매가 가장 분명한 상품 및 부동산 시장에서 특히 도움이 된다는 것을 발견한다. 주식 시장에서 나는 자본 지출과 같은 지표를 살펴본다. 즉, 기업(그리고 정부)이 인프라, 공장 등에 많이 투자하고 있는지 아니면 적게 투자하고 있는지 여부이다. 그것은 기업들이 현재의 수요를 미래의 강력한 수요 성장에 외삽하고 있는지 여부를 반영한다. 이 게이지는 다른 게이지와 비슷한 40번째 백분위수에 있습니다.
이 이미지에 대해 제공된 alt 텍스트가 없습니다.
이것을 가지고 무엇을 할지는 전술적인 결정이다. 역전현상이 컸지만, 미래 수익에 대한 할인은 역사에 비해 다소 높은 수준을 유지하고 있다. 그리고 어느 쪽이든, 거품이 정상 수준으로 되돌아가는 것에 비해 지나치게 자주 수정된다(기초적인 요소가 제안하는 것보다 더 많이 팔린다. 하지만 저는 시장에서 현재 일어나고 있는 일들을 고려하여 이 업데이트된 읽을거리들을 여러분에게 전달하고 싶었습니다.
Bridgewater Daily Observations는 Bridgewater Associates, LP의 소유물로, 정보 및 교육 목적으로만 배포됩니다. 수혜자의 구체적인 투자 필요성, 목표 또는 관용에 대한 고려가 없다.
또한, 브리지 워터의 실제 투자 위치해 주고 있다. 종종, 그 결론을 논의했다 여기에 요인 고객의 투자 규제, 포트폴리오 rebalancing하고 거래 비용과 같은 다른 사람들 중에 숫자에 기초한 것과 상당히 다르다. 수혜자는 다른어떤 투자 결정을 내리기 전에 세금 고문을 포함한 자신들의 자신의 보좌관을 참조해야 한다. 이 보고서는 아닌 제의를 판매하거나 제의를 유가 증권이나 다른 악기들 언급한 구입 권유.
브리지 워터 연구 실제 브리지 워터 거래 손실에서 데이터를 포함한 공공, 민간 및 내부 출처로부터 자료와 정보를 활용하다. 소식통에 따르면, 호주 통계국, 블룸버그 재정 LP인 캐피털 이코노믹스 CBRE, Inc., CEIC 데이터 회사인 Clarus 금융 기술, 콘퍼런스 보드 캐나다의 합의 경제 주식 회사, Corelogic, Inc., CoStar 부동산 정보 주식 회사, CreditSights, Inc., 크레디트 시장 분석 회사 Dealogic LLC, DTCC 데이터 저장소를 포함한다. (미국), LLC, Ecoanalitica, 에너지 측면, EPFR 글로벌, 유라시아 그룹과 유럽 금융 시장 연구소 EMMI, Evercore, Factset 연구 시스템, 하포 인코퍼레이션 –. 파이낸셜 타임스는 리미티드 GaveKal 연구 회사인 글로벌 금융 데이터, Inc., HarvardBusinessReview, Haver 전문가, 하포 인코퍼레이션. 그 투자 기금 연구소 캐나다의 ICE데이터 상품 영국 유한 공사, HIS마르, Impact-Cubed, 제도 주주 가치 서비스, Informa(EPFR), 투자 회사원, 국제 에너지 기구(IEA), 투자 관리 협회, JP모건, Lipper 금융, Mergent, Inc., 금속 포커스"'무디스 애널리틱스'사 주식 회사, MSCI지수, Inc.., 전미 경제 연구원의 경제 협력 개발 기구(OCED), 연금&투자 리서치 센터 Qontigo 회사, Quandl, Refinitiv RP데이터"Rystad 에너지사 S&P글로벌 시장 정보 주식 회사, Sentix 회사, 스피어스&어소시에이츠, Inc., 스테이트 스트리트 은행과 신탁 회사 Sustainalytics, 토템 매크로., 국제 연합, 미국의 자원 Verisk-Maplecroft, Vigeo-Eiris(V.E), 풍력 Information(Hongkong)회사, 우드 매켄지 리미티드, 세계의 금속 통계, 그리고 세계 경제 포럼. 우리가 외부에서 신뢰할 수 있게 정보를 고려한다면 그것의 정확성을 책임이라고 생각하지 않는다.
관점은 여기에 이 보고서의 날짜로 삼고 예고 없이 변경될 수 있다 전적으로 브리지 워터의 표현했다. 브리지 워터 하나 이상의 유가 증권이나 파생 상품 및/또는 논의하는 위치에서 중요한 금융 이익이 되다. 이 보고서 보상 다양한 요인들에 근거하여 받을 준비하는 다른 일들 사이에 자신들의 업무와 회사 수익의 질을 포함해서 책임 있는.
출처: 링크드인 레이달리오 https://www.linkedin.com/pulse/popping-bubble-stocks-update-ray-dalio/